16 Interesting Coffee Consumption Statistics: 2024 Update
The past several years have presented many challenges. Despite (or maybe because of) these difficulties, the coffee industry is thriving in America.
If you’re thinking of starting a coffee business, you need to know the facts. I’ve compiled the ultimate guide to coffee consumption statistics in the United States.
Just a hobbyist coffee drinker? That’s cool too! Take a look to see how your coffee consumption habits compare to the rest of Americans. (Spoiler alert: you’re not the only one who drinks more than four cups of coffee per day).
Key Takeaways: Coffee Consumption Statistics
- Three in four Americans drink coffee every day.
- Nearly half of Americans buy coffee from a cafe at least once a week.
- There are over 38,000 coffee shops in the USA.
- Americans most often drink coffee as traditional, brewed coffee.
16 Interesting US Coffee Consumption Statistics & Facts in 2024
Thinking about joining the coffee industry? If so, you need to learn the habits of American coffee consumers.
Here are 16 coffee consumption statistics to help you learn about the coffee market. I’ve highlighted studies from the National Coffee Association, Drive Research, and Reuters. You might also be surprised to read a study by Neilson from Hemp Industry Daily.
Content to keep coffee a hobby? Find out how you compare to the average American coffee drinker. Let’s get into it.
1. A Majority of Americans Drink More Than Three Cups of Coffee per Day

Over 60% of Americans have over three cups of coffee per day, according to a recent report by Drive Research.
Half of the respondents said they drink between three and five cups a day. And 3.3% of the population is hyper-caffeinated, drinking more than eight cups of coffee daily.
Around 40% of the population responded that they drink less than two cups of coffee every day. Slackers.
2. Three in Four Americans Consume Coffee Every Day
Three out of four Americans drink coffee every day. That’s around two hundred and fifty million daily coffee drinkers.
The survey also found that 18% of Americans consume coffee most days, while 9% drink it sometimes.
A few quick multiplications will give you a good idea of just how popular the coffee industry is. Two hundred and fifty million times three hundred and sixty-five days in a year? The U.S. is drinking at least ninety-one billion cups of coffee in one year alone.
3. The U.S. Has Over 38,000 Branded Coffee Shops
A Reuters study reports that there are 38,411 different branded coffee stores in the U.S.
This mind-boggling figure from mid-2022 puts shop numbers above pre-pandemic levels. In 2020, there were 37,189 coffee stores in the U.S.
So we’re looking at an increase of 1,222 despite Covid closures.
4. Only 1% of US Coffee Drinkers Consume CBD Coffee
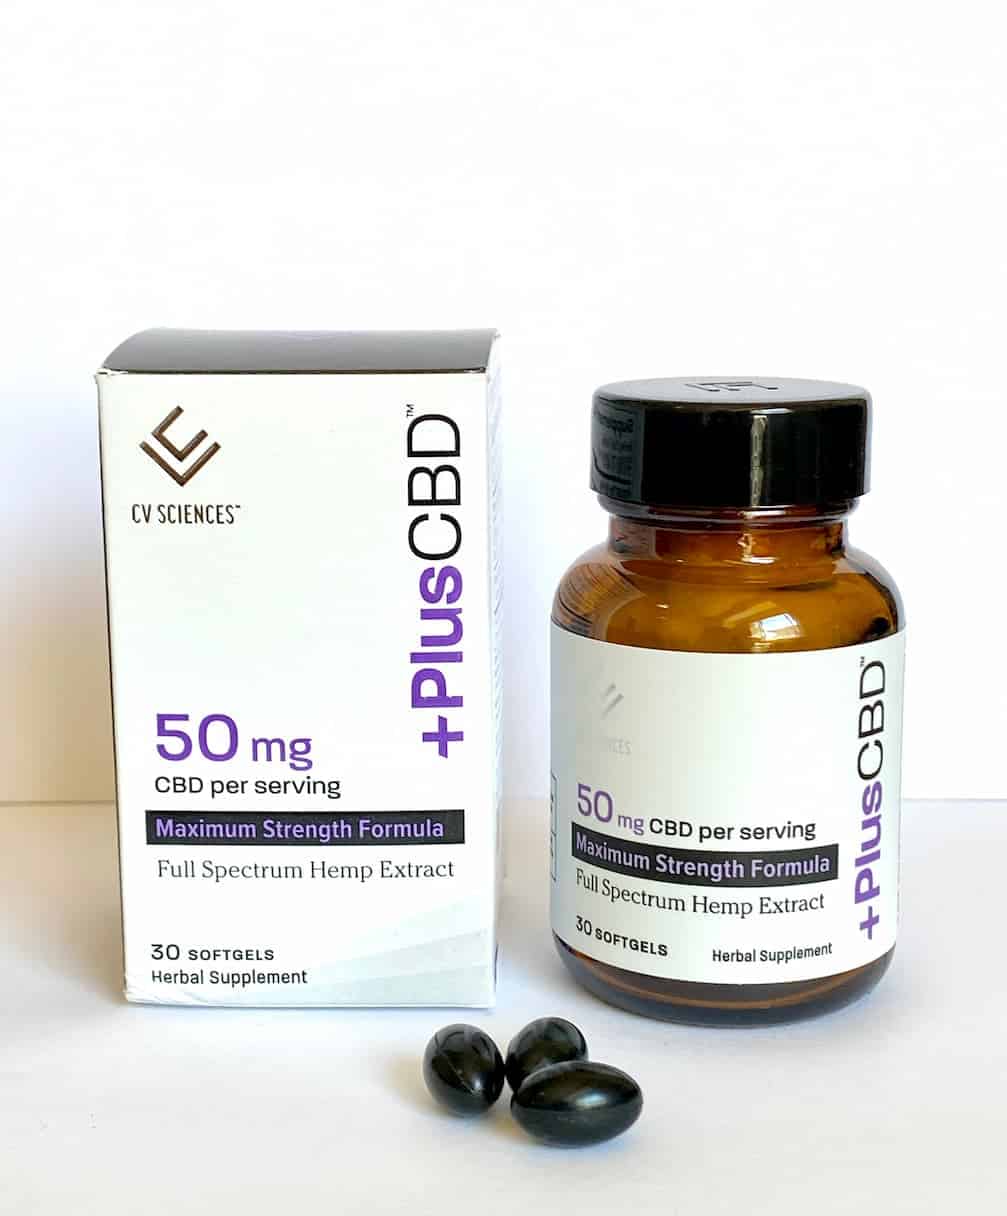
CBD is on the rise as droves of consumers take advantage of its potential health benefits. But it seems they’ve yet to show interest in mixing CBD with coffee.
Only 1.1% of U.S. coffee drinkers regularly drink CBD coffee. At least according to a survey conducted by Nielsen in September 2020.
In the same study, only 3% expressed interest in trying a CBD-infused coffee within the next 12 months.
This research shows that Americans want to keep their coffee and CBD separate — at least for the time being.
5. Americans Spend More for At-Home Coffee Than They Do at Coffee Shops
If you’re counting coffee beans, you can save money by brewing coffee at home. The cost of buying specialty drinks at coffee bars adds up fast.
But most people drink WAY more coffee at home, thus spending more on home brewing.
A recent study questioned Americans who make coffee at home every day. A third of participants said they spend between $11 and $20 per month. And 40% spend between $21 and $40. A further 11% will spend over $40 per month.
Compare this with the survey’s findings on cafe spending. About 23% of respondents spend between $11 and $20 per month, 27% spend between $21 and $40, and 11% spend over $40 per month.
The biggest difference is among Americans who spend less than $10 per month: 13% at home; 31% at a cafe.
Overall, Americans spend more money on their at-home coffee habits.
6. Half of Americans Prefer Medium Roast Coffee
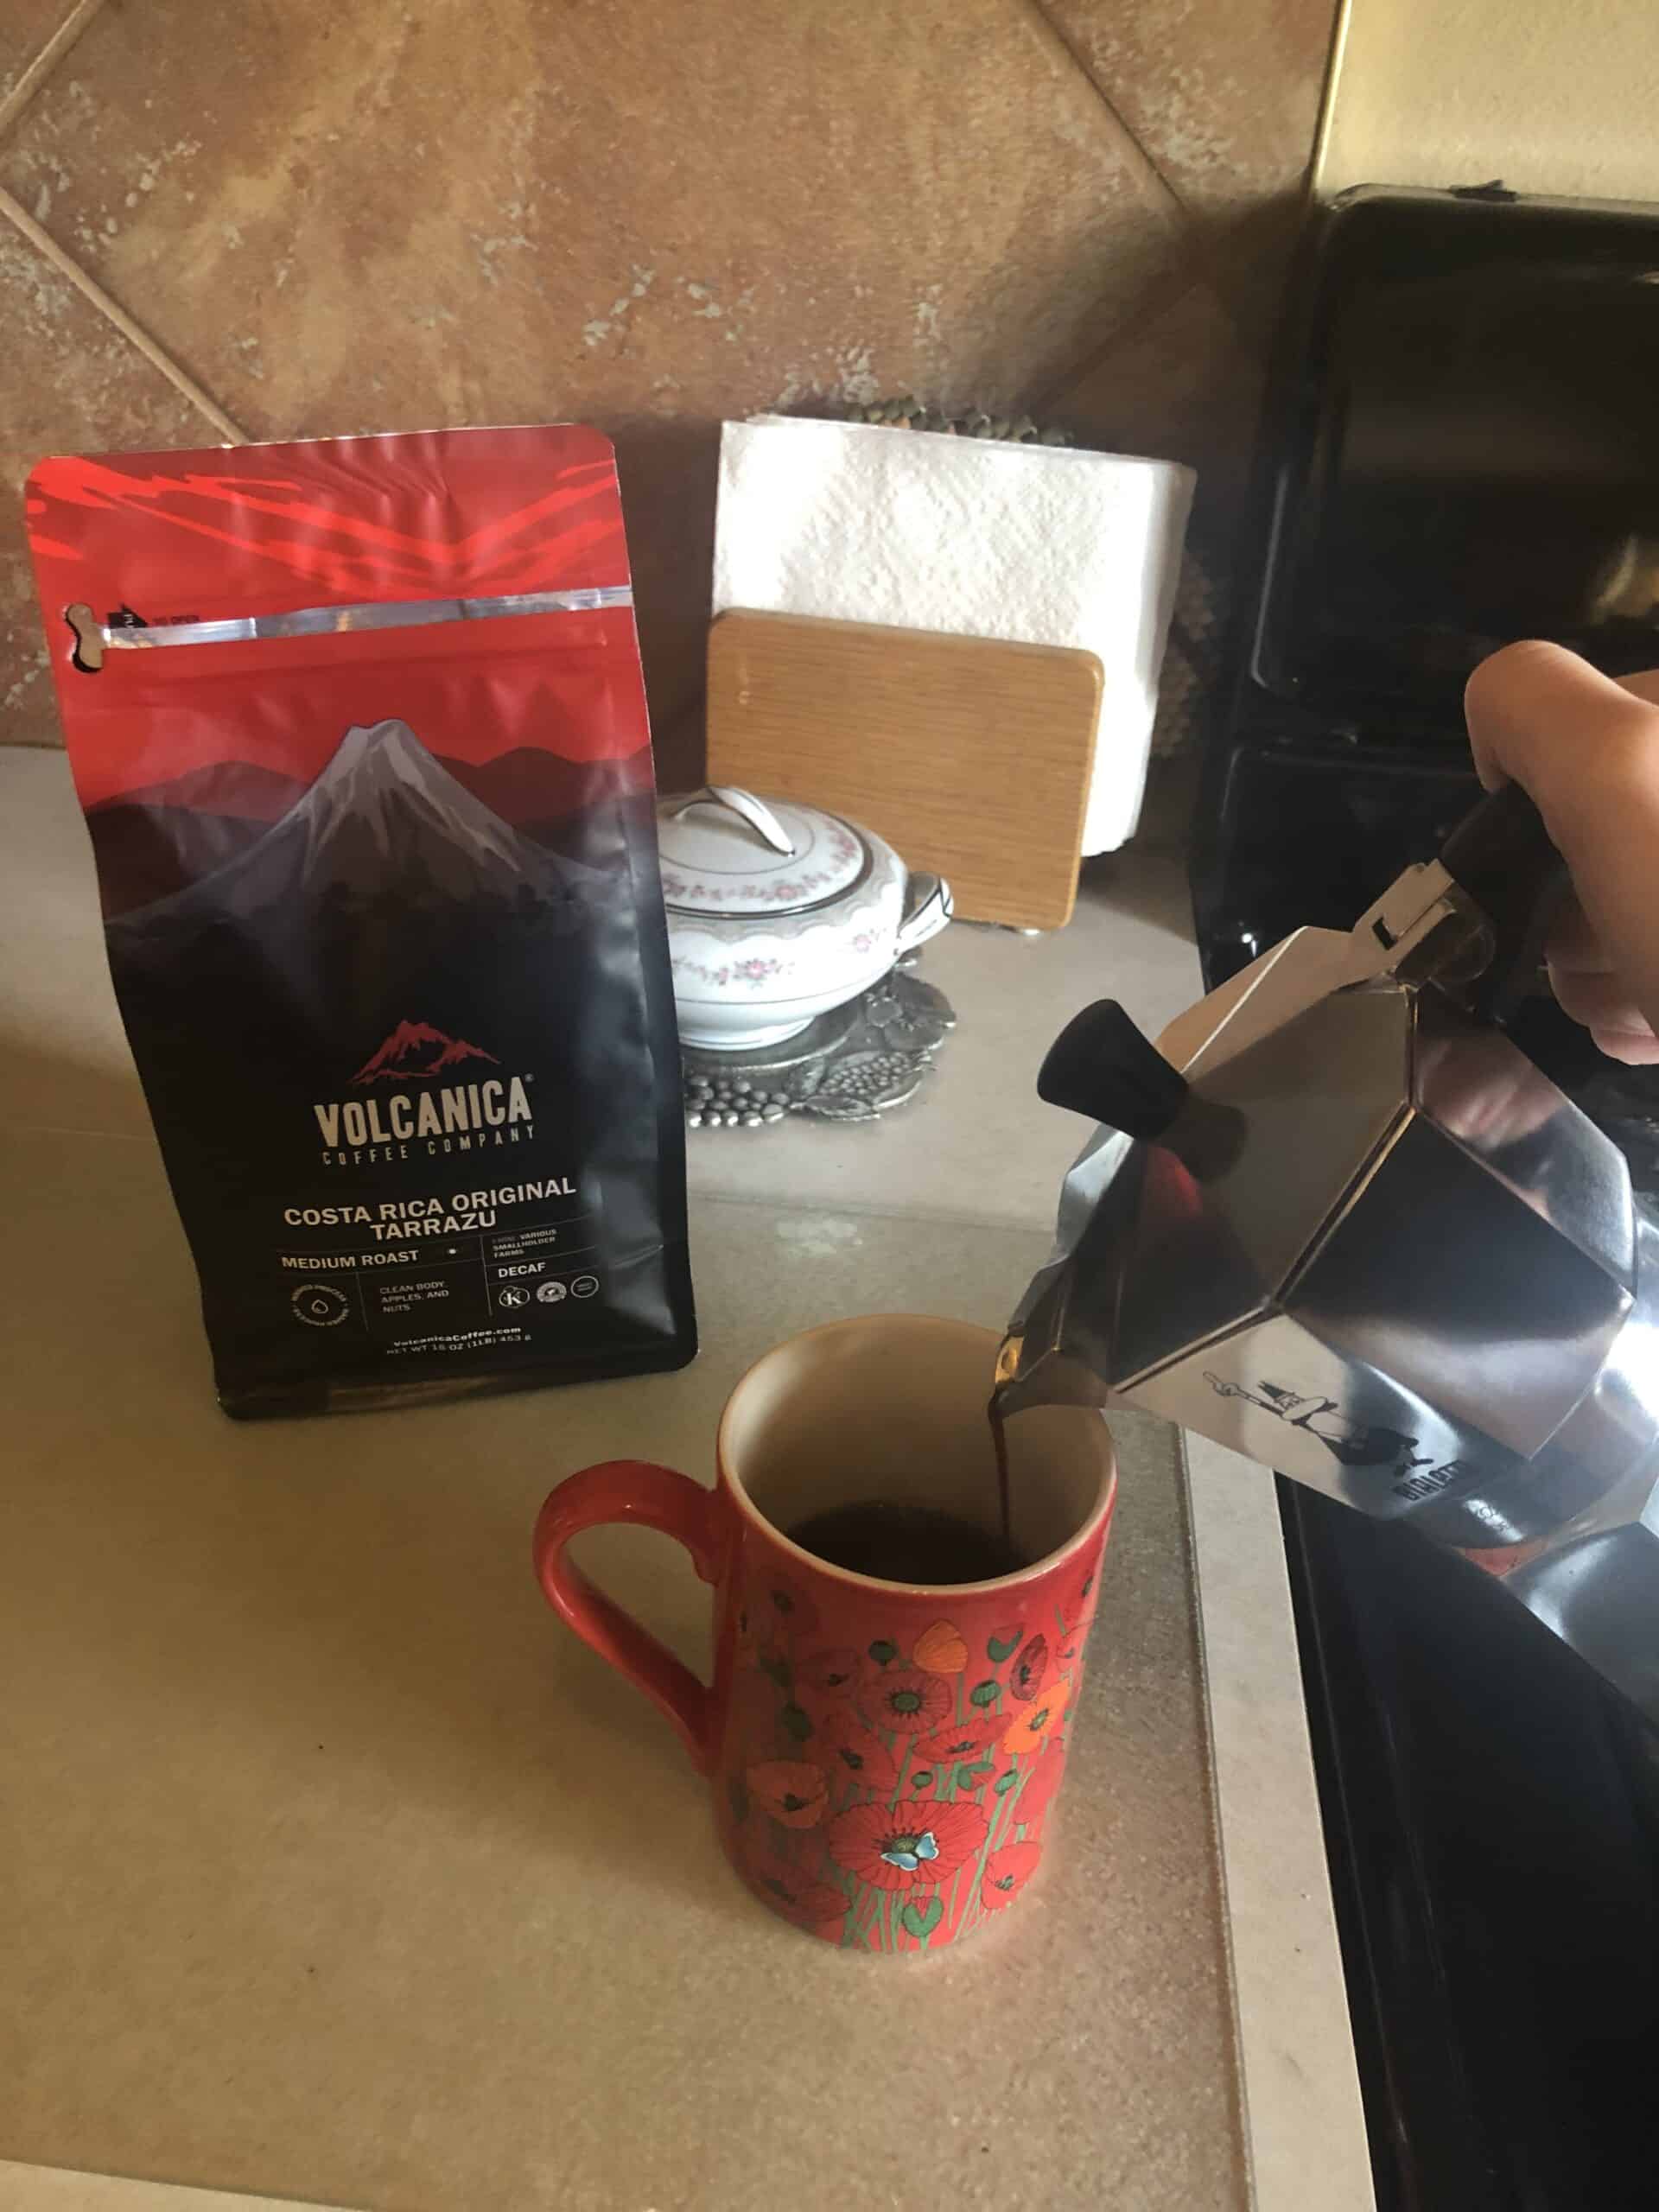
There are a lot of different ways to enjoy drinking coffee. One of the biggest factors in the final flavor is the roast type. It seems that medium roasts have stolen the hearts of American coffee drinkers.
In a Drive Research study, 49% of respondents listed medium roasts as their roast of choice. Dark roasts followed closely behind (28%), followed by light roasts (12%). A further 11% of respondents said they did not have a preference.
7. Americans Prefer Drip Brewing and Keurig Brewing
A 2022 survey asked U.S. coffee drinkers about at-home brewing methods. The results featured a tie! Both drip brewing machines and Keurig brewers pulled in 31% of total U.S. coffee drinkers.
Coming in second, we have instant coffee at 6%. French press follows at a paltry 4%.
A further 4% of respondents said they preferred to brew their coffee “another way.” This category includes using a percolator, espresso machine, pour-over, and Aeropress.
Espresso machines are big in the coffee market. But this study suggests that regular coffee drinkers often prefer a simpler method.
8. Two-Thirds of Coffee Drinkers in America Make Coffee at Home Every Day
The same Drive Research study on U.S. caffeine consumption found that 68% of Americans brew coffee at home every day. That’s two-thirds of coffee drinkers.
The survey also showed that a further 12% brew coffee at home four to six times per week. Only 2% of American coffee consumers responded that they brew coffee at home less than once a week.
These figures indicate that the vast majority of coffee drinkers in America use home brewing.
9. The Most Popular Coffee Shop Drink Is the Flavored Latte
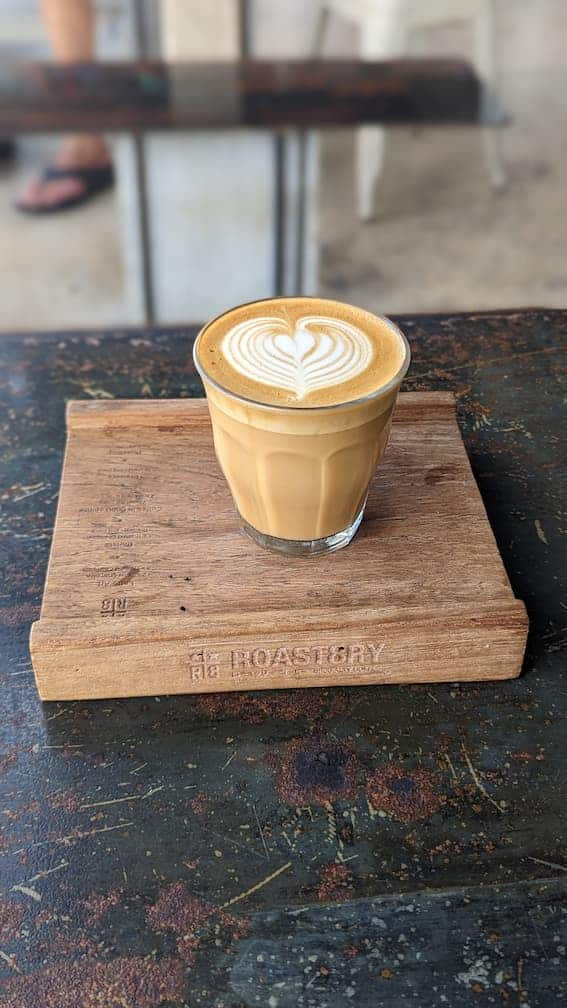
Coffee shops are always inventing new drinks — often shot-flavored variations of a latte. It seems American hearts are still beating for this time-old classic.
In a recent survey, 38% of respondents selected a flavored latte as their go-to cafe beverage.
The flat white was close behind at 32%, followed by regular drip coffee at 31%. Cold brew coffee received 30% of the votes, cappuccinos 29%, and Americanos 20%.
The “other” category included coffee drinks like mochas and macchiatos. Surprisingly, it only accounted for 8% of responses.
10. Over a Third of Coffee Drinkers in America Prefer Their Coffee Unsweetened
A survey asked respondents to specify how sweet they like their coffee. The leading response was not sweet at all. Yep, apparently, 38% of coffee drinkers in America prefer to drink coffee unsweetened.
The response “somewhat sweetened” followed at 28%, and “a little sweetener” at 22%.
11. A Third of Americans Buy From a Coffee Shop 1-3 Times per Week
32% of Americans buy coffee from a cafe 1-3 times per week.
Only 6% buy coffee from a cafe every day, while 22% say they never buy coffee from a coffee shop. And 30% buy coffee from a coffee shop more infrequently, with a vague “less than once per week.”
Keep in mind, this survey is looking at a cup of coffee. It does not consider how often people buy coffee beans from a cafe.
12. Half of Americans Who Drink Non-black Coffee Use Generic Coffee Creamer
Drive Research surveyed Americans who add milk or cream to their coffee. Of those surveyed, 48% of them like generic coffee creamers.
Half-and-half garnered 39% of responses. Two percent milk came in with 18%, while light versions of creamers came in with 16%.
For those interested in dairy-free options, almond milk got the greatest response at 14.2%. Oat milk was second (9.5%), followed by coconut (8.7%) and soy (4.8%) milk options.
13. Americans Prefer Coffee With Cream And/or Sugar Regardless of Age
A study by YouGov looked at the correlation between age and preferred way of drinking coffee. How do the overwhelming majority of coffee drinkers take their java? With a combination of cream and sugar, regardless of age range.
The highest percentage was in the “65 and up” age range, with 54% preferring coffee with cream and sugar. This figure is in contrast to 43% of people aged 18-29.
The “no preference” and “not applicable” categories most prominently featured respondents aged 18-29. Perhaps younger coffee drinkers are less settled on their choices.
Another interesting stat from this study was the black coffee drinking habits. As age increased, so did the percentage of black coffee drinkers. Only 15% of 18-29-year-olds responded that they prefer to drink black coffee. But that figure grew to 25% for people over the age of 65.
14. Men Are More Likely To Drink Their Coffee Black
The same study by YouGov also looked at coffee-drinking preferences amongst men vs women.
The study found that a greater percentage of men drink their coffee black (22% for men, compared to 17% for women). A greater percentage of women drink their coffee with cream and sugar (56% for women, compared to 46% for men).
The same study also found that women are more likely to have a strong preference between black coffee and coffee with cream and sugar.
15. Starbucks Is America’s Favorite Coffee Brand

There are hundreds of brands selling bagged coffee. Drive Research found that Starbucks is America’s first choice. Starbucks garnered 39% of responses. Folgers followed pretty closely behind, gaining 35% of responses. And Dunkin Donuts rounded out third place with 30%.
Nearly a quarter of people surveyed selected “other” as their favorite coffee brand. These responses might suggest support for independent roasters and specialty coffee brands.
Note: respondents could choose up to three favorite brands for coffee beans.
16. The Most Common Type of Coffee Consumed Is Non-specialty Coffee
The National Coffee Association recently studied trends in specialty vs non-specialty coffee consumption. The survey also looked at espresso vs non-espresso-based coffee beverages.
So what’s the most common type of coffee consumed in America? Non-specialty, non-espresso-based coffee beverages.
Traditional, non-specialty coffee garnered 29% of total responses. Traditional specialty coffee received only 9% of responses.
Wrapping Up: Coffee Drinking Statistics
You don’t have to be a National Coffee Association expert to realize that Americans love coffee. The majority of American coffee drinkers consume more than three cups every day of the week.
Despite this growth, traditional coffee tastes still dominate the coffee industry.
The average American coffee drinker drinks coffee at home. And they use a drip coffee maker to brew said java.
In coffee shops, the flavored latte remains a popular choice for coffee drinkers.
Whichever way you spin these coffee industry statistics, American coffee consumption is on the rise. More coffee shops are opening. And more and more people are becoming regular coffee drinkers.